

Formally, my PhD work consist of several parts. Most important parts are released as a separate articles.
The most interesting results of the work are:
1. A new method of local dynamics analysis of coupled map lattices
(CML) was proposed.
2. Analysis of different 1D lattices with space defects (and new effects
of global behavior that was found)
3. New effects of global behavior of CML was found.
Maps can represent some systems. One of the most popular example of map is f(x)=1-ax^2. A set of the Maps can be distributed in the space (for 1D space it's a line). The maps can interact between each other. Such interacted maps can describe more complicated and more realistic systems.
My job was to construct different models of interacting maps (map lattices) and explore them. Also, it was a good idea to propose a new method of local dynamics analysis, because old and well-known methods describe the behavior of full system asymptotically (with time tends to infinity). But we need to know the stage of system at the present moment and locally. If so, we can trace how the chaos (or order) is spreading (in time) in the system.
The new method was proposed by Sergey Rybalco. It's very simple. Of cause, there are some others but this one is most useful and illustrative. (It's an other problem to construct some new and compare with others, for example with the Fourier transformation).
1. Here is the PDF & PS papers about main results on coupled map lattices (Russian)
2. Same, PDF in English
This artice was publish in Teoreticheskaya Matemat cheskaya Fizika,Vol.132,No.1,pp.105 125,July,2002.
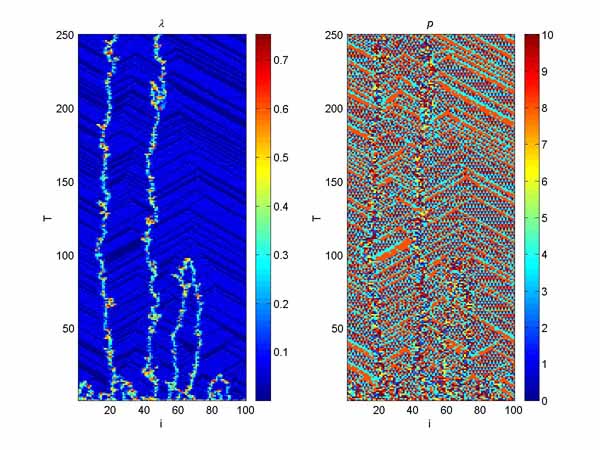
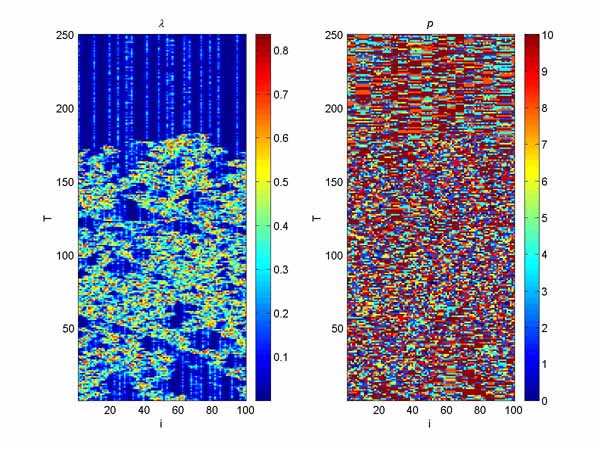
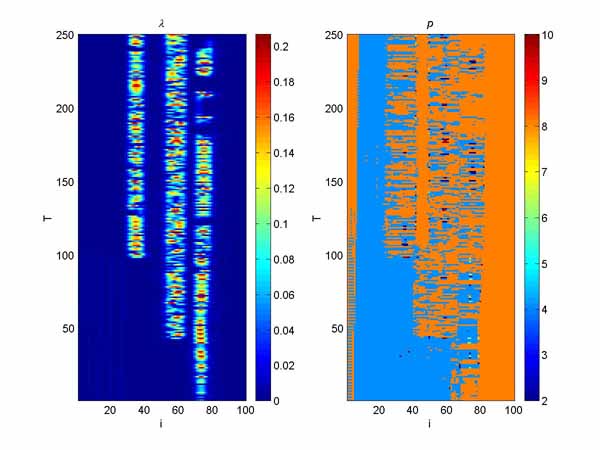
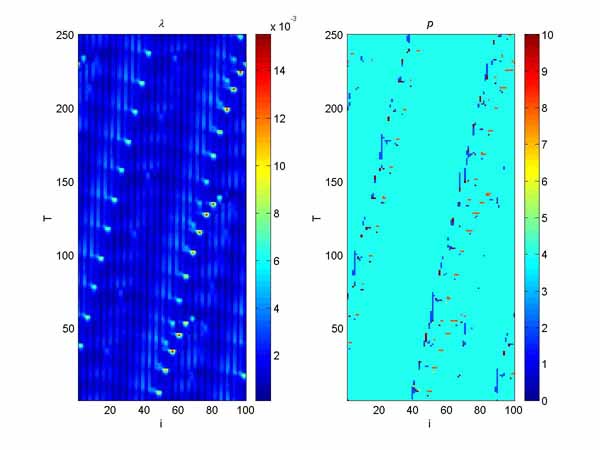
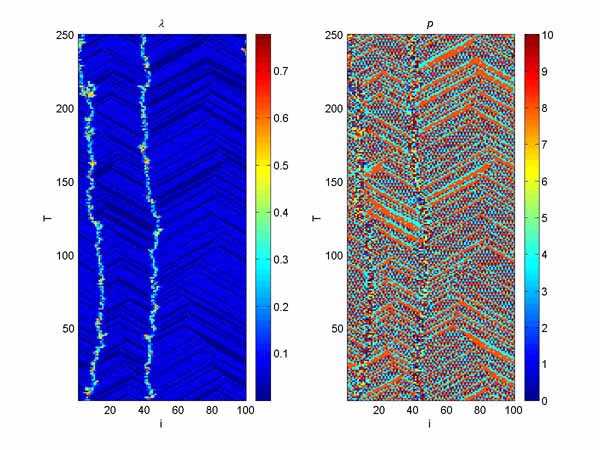
The main reason, why I select this field of investigation (chaos, dynamic systems, etc) was very nice pictures, that could describe the behavior of such systems. Here you can find some nice pictures, that are results of my work on coupled map lattices. There two images on most pictures. The X axis represent the number of map in the lattice (in most cases there are 100 maps in a line). The Y axis represent the truncated time (don't ask me here why it's truncated, ok, let it be just the time). And the points represent state of the system, which was determined by Rybalko method (Lambda values; color = period = order, black = zero period = chaos) and the period of cycle (P values).
3. Some nice color pictures
Also, some new result was obtained for periodic perturbation of the system by period 2 & 3.
4. Article (PDF, PS) about periodic perturbation of the 1D map (Russian)
5. 3D model. AVI file (4,4MB).